China-Africa Engagement Index
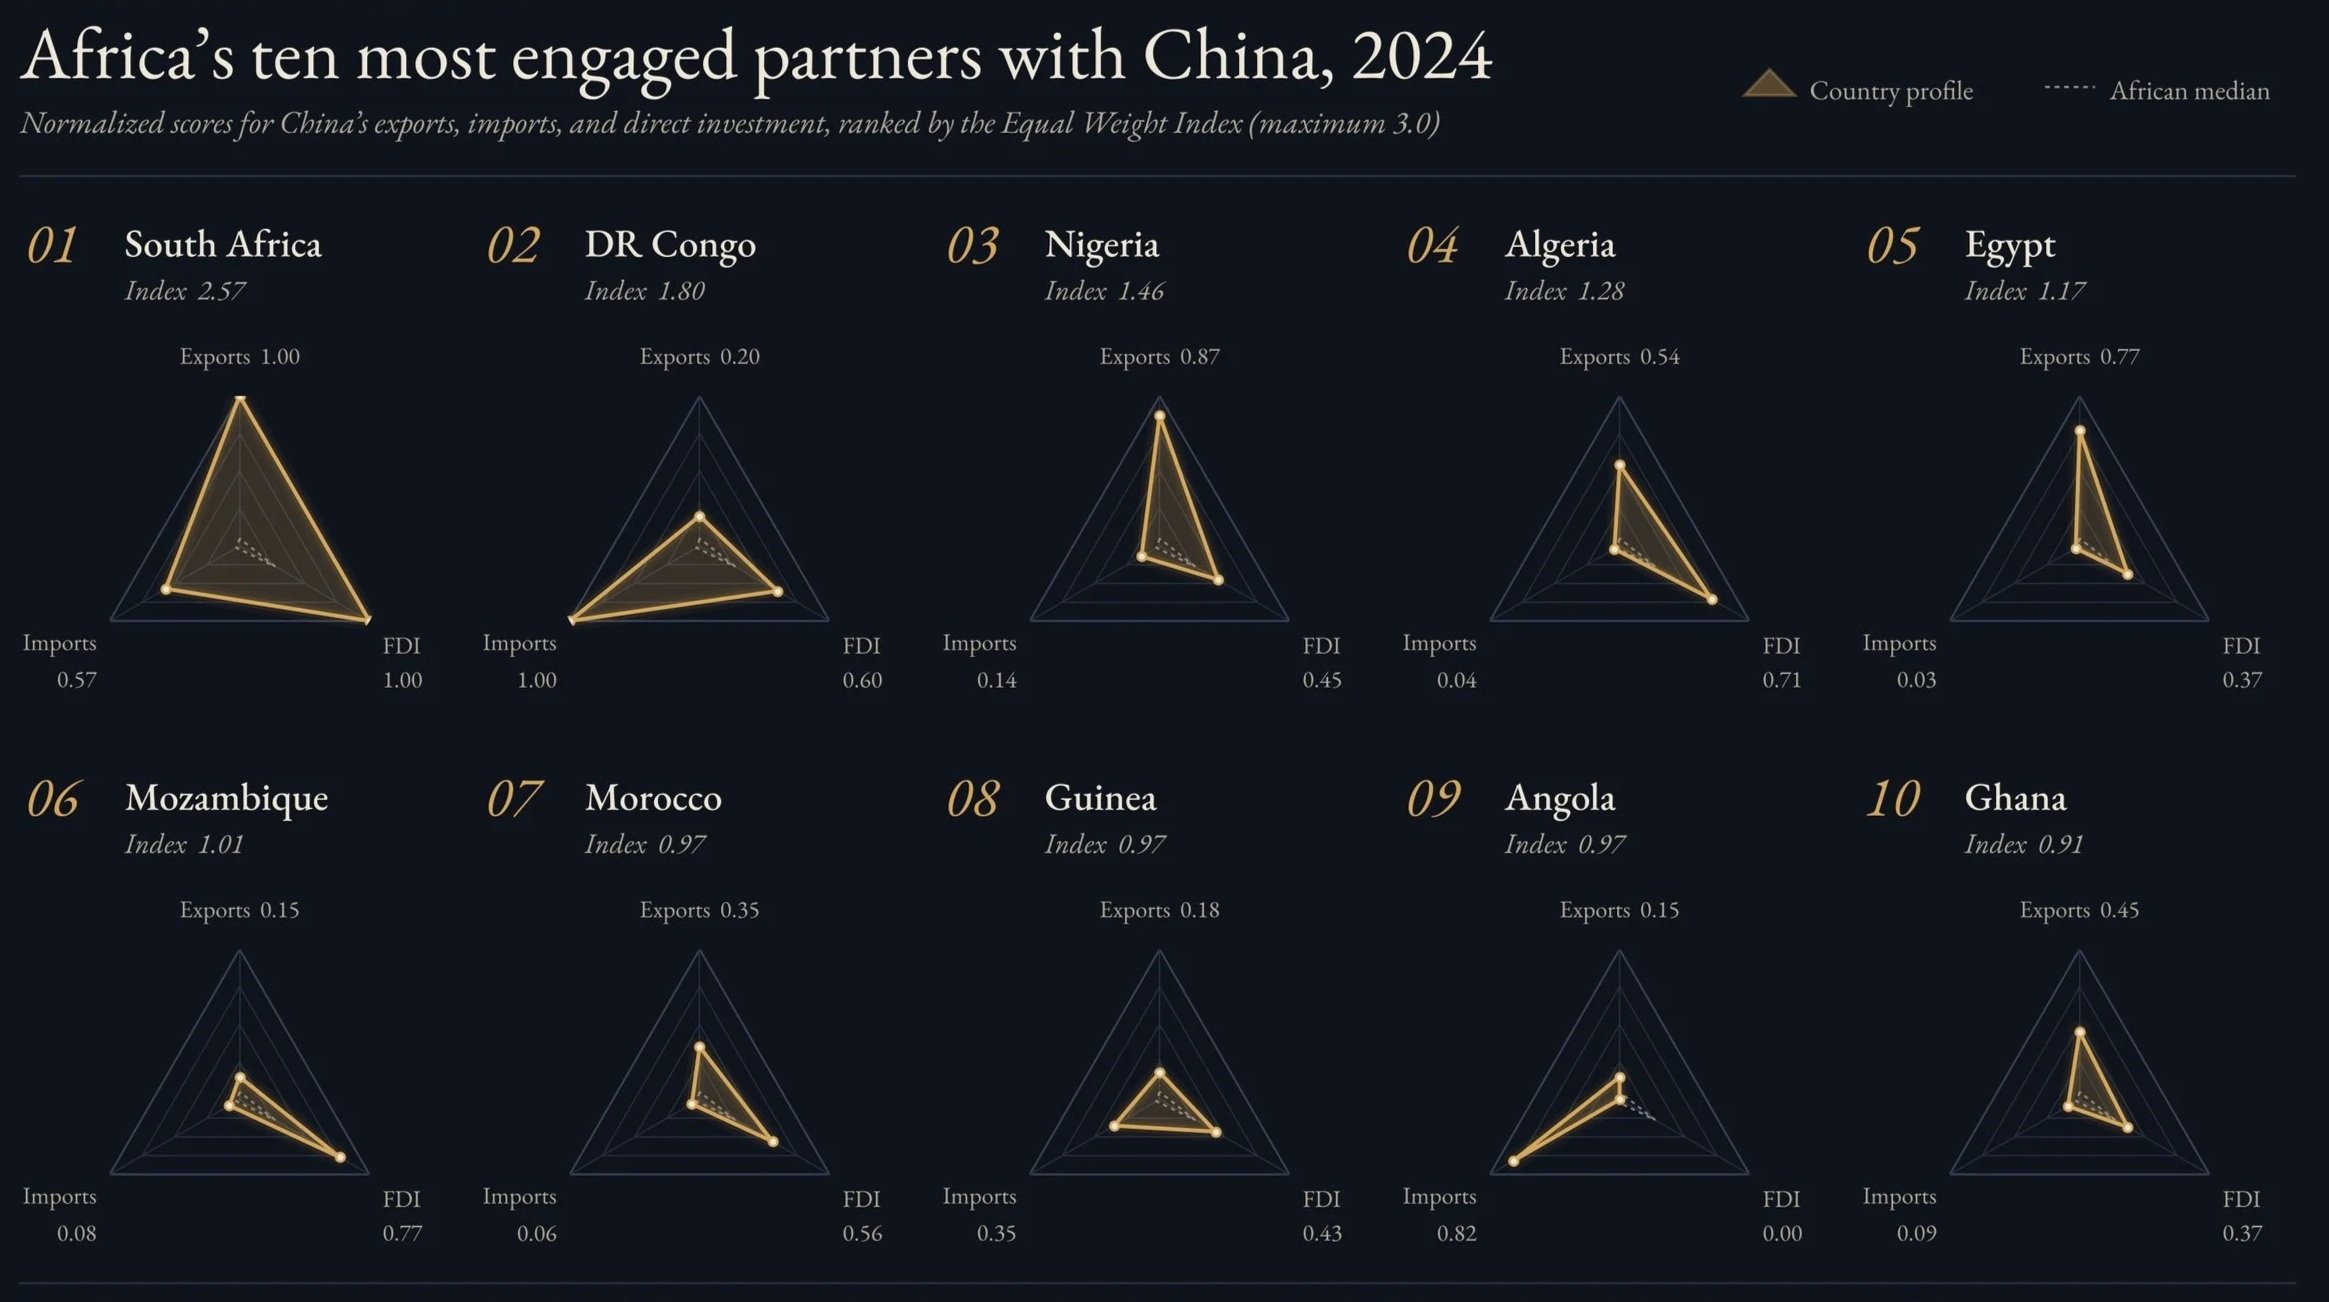
The China-Africa Engagement Index (CAEI) is a comprehensive, longitudinal dataset designed to measure the depth and nature of China’s economic engagement with African countries from 2003 to 2024. It consolidates key indicators of bilateral economic activity between China and each of 54 African countries into a structured format, offering annual data across multiple dimensions. The full database can be downloaded here: CAEI Database.
Last updated: October 2026 (now covers 2023–2024).
Core Variables:
Exports (to Africa): China’s annual exports to each African country (in USD millions).
Imports (from Africa): China’s annual imports from each African country (in USD millions).
FDI Flows: Annual Chinese foreign direct investment into each African country (in USD millions). Flows can be negative, for example when investment is withdrawn.
Derived Indicators:
Normalized Scores (0–1 scale), using min–max scaling across countries within each year:
Exports Norm
Imports Norm
FDI Norm
Composite Indices:
Equal Weight Index: Sum of normalized export, import, and FDI scores (range 0–3).
40/40/20 Index: Weighted index giving 40% weight to exports, 40% to imports, and 20% to FDI (range 0–1).
Per Capita Metrics:
Per Capita Exports / Imports / FDI
Normalized Per Capita Scores
Per Cap Equal Index and Per Cap 40/40/20 Index (constructed similarly using normalized per capita scores)
Sources:
Trade and FDI data come from the Johns Hopkins SAIS China Africa Research Initiative (CARI), November 2025 release. Trade figures are UN Comtrade data as reported by China, except imports from South Africa, which are as reported by South Africa. FDI figures come from China’s Ministry of Commerce Statistical Bulletin of China’s Outward Foreign Direct Investment. São Tomé & Príncipe trade for 2023–2024 comes directly from UN Comtrade. Population data come from the World Bank’s World Development Indicators.
Note: Because scores are scaled within each year, they show a country’s position relative to other African countries in that year. They are not absolute levels, so compare raw values when looking at change over time.